U.S. States Producing the Most Oil
With gasoline prices reaching their highest levels since 2014 this fall, consumers, policymakers, and economic experts have lately turned their attention to the state of oil production in the U.S. and worldwide.
The COVID-19 pandemic has been an uneasy time for oil, as with many other products and sectors of the economy. The price of oil futures briefly turned negative in the first months of the pandemic, and remained at relatively low levels through most of 2020 and the first part of 2021, a product of reduced demand for fuel and a price war between Russia and Saudi Arabia. While demand has recovered the longer the pandemic has gone on, oil production has been affected by the global supply chain struggles that many other industries are experiencing as well. As a result, oil prices have rebounded to their highest levels in more than half a decade.
The volatility of the oil markets during the COVID-19 pandemic highlights the challenges of having a critical product like oil be part of a complex globalized economy. Even before the pandemic, many political and economic leaders had been seeking to lessen U.S. dependence on foreign sources of oil to make the country more self-reliant in its energy mix.
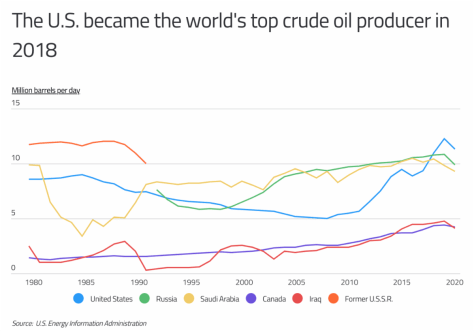
The U.S. has had success on this front in recent years. The U.S. saw a steady decline in oil production from the late 1980s to the mid-2000s, a product of a range of factors including decreased demand, the growth of the environmental conservation movement, and increased involvement in the Middle East. Oil production in the U.S. bottomed out at 5 million barrels per day in 2008. Since then, as policymakers have prioritized domestic production and the rise of techniques like fracking have reduced the cost of extracting petroleum, U.S. production has boomed. In 2018, the U.S. surpassed Russia and Saudi Arabia to become the world’s leading producer of crude oil.

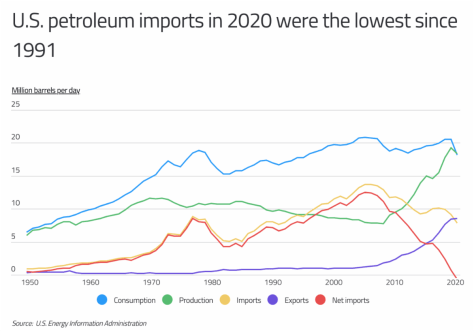
The result of this growth in domestic production has been a sharp decline in petroleum imports. Imports have fallen since their peak of 13.7 million barrels per day in 2005, dropping to only 7.85 million in 2020. After taking exports of 8.5 million into account, the U.S. actually became a net exporter of oil for the first time last year.

In the U.S., as is the case globally, oil reserves are not evenly distributed, and some states produce significantly more than others. Texas is far and away the leading oil producer in the U.S. at nearly 1.8 billion barrels annually—more than four times the total for runner-up North Dakota. States in the Plains and Mountain West fare best, along with Alaska and Gulf Coast states like Louisiana and Mississippi.
The data used in this analysis is from the U.S. Energy Information Administration. To determine the states producing the most oil, researchers at Commodity.com calculated the total annual crude oil production in 2020. In the event of a tie, the state with the higher 10-year change in annual crude oil production was ranked higher. Researchers also included the latest statistics on proven oil reserves, the number of operable petroleum refineries, and per capita oil consumption.
Here are the states producing the most oil.
| State | Rank | Total annual crude oil production (thousand barrels) | 10-year change in annual crude oil production | Crude oil reserves (million barrels) | Number of operating refineries | Per capita oil consumption (barrels) |
|---|---|---|---|---|---|---|
| Texas | 1 | 1,776,449 | +316.3% | 18,622 | 31 | 53.6 |
| North Dakota | 2 | 434,889 | +286.4% | 5,897 | 1 | 46.8 |
| New Mexico | 3 | 370,402 | +464.9% | 3,456 | 1 | 24.1 |
| Oklahoma | 4 | 171,740 | +144.7% | 2,047 | 5 | 25.0 |
| Colorado | 5 | 167,832 | +407.5% | 1,414 | 2 | 18.2 |
| Alaska | 6 | 163,852 | -25.1% | 2,680 | 5 | 53.2 |
| California | 7 | 143,114 | -28.6% | 2,213 | 14 | 16.8 |
| Wyoming | 8 | 89,091 | +65.3% | 1,013 | 4 | 49.9 |
| Louisiana | 9 | 36,708 | -45.7% | 389 | 16 | 80.9 |
| Utah | 10 | 30,951 | +25.5% | 275 | 5 | 18.5 |
| Kansas | 11 | 28,260 | -30.2% | 313 | 3 | 23.2 |
| Ohio | 12 | 23,819 | +399.1% | 88 | 4 | 18.1 |
| West Virginia | 13 | 19,059 | +934.7% | 13 | 1 | 22.9 |
| Montana | 14 | 18,985 | -25.1% | 298 | 4 | 31.4 |
| Mississippi | 15 | 14,166 | -40.9% | 114 | 3 | 24.9 |
| United States | – | 4,129,563 | +106.3% | 44,191 | 129 | 22.8 |
For more information, a detailed methodology, and complete results, you can find the original report on Commodity.com’s website: https://commodity.com/blog/


Leave a Reply